
Rooting Out Cpu Bottlenecks From Asyncio Based Api Services
At work, we use a Python Tornado based API server that now uses an asyncio based event loop. Event loop based API servers (like Tornado via python asyncio, and expressJS on Node) excel at is handling large volumes of traffic that are primarily IO bound (i.e. for services that mostly just read data from DB/cache, do a few transformations on them, and send them back to the client).
What event loops are quite terrible for are tasks that involve a lot of CPU usage. One of the best write-ups on what to do and NOT do with event loop based services is the guide titled Don’t Block the Event Loop that is part of the NodeJS docs. While a lot of it specific to NodeJS, a lot of the advice is valid for any event loop based API server, such as most Python frameworks that leverage asyncio.
Bottomline is that we need to guard against any of our services doing any CPU intensive processing as part of a request handler. A lot of the time this is obvious: crypto related tasks, image compression, data encoding etc. all throttle the CPU, but these things stick out quite obviously and the bottlenecks manifest at development time itself.
Then there are insidious CPU heavy tasks is JSON parsing or serialization. We make frequent use of json.dumps and json.loads and these tend to kill our server’s performance because JSON parsing/serialization is CPU intensive. Trouble is that JSON encoding/decoding slips under your nose during development, however, ends up resulting in your server loads spiking at scale in production.
This document illustrates how to profile a specific service to check if it is CPU bound to help with optimizing it.
Tool Setup
The following are the tools you need to do profiling of our services:
- Apache
ab- This is the tool we’ll use to hit our local API instance with a load.
- On Ubuntu, you can install this by running:
apt-get install apache2-utils
- SnakeViz
- This is a tool used to visualize the file generated by Python’s
cProfileprofiler. - Installed using:
pip install snakeviz
- This is a tool used to visualize the file generated by Python’s
Profiling
The first step is to start the API server with profiling enabled. We use Python’s built-in cProfile profiler.
Here’s how to run the our API server with profiling enabled.
python -m cProfile -o instrument_details_profile.prf server.py
Load Testing
The next step to the profiling process is to hit the server with a load. The following snippet demonstrates how to hit the API server with a load to the instruments details service.
Note that in case you have any authentication cookies that are needed to be sent to the service, you can add them via -C option that ab provides.
$ ab -n 10000 -c 20 https://api.sensibull.test/v1/instrument_details
You ought to end up with some results that look like this:
Benchmarking api.sensibull.test (be patient)
Completed 1000 requests
Completed 2000 requests
Completed 3000 requests
Completed 4000 requests
Completed 5000 requests
Completed 6000 requests
Completed 7000 requests
Completed 8000 requests
Completed 9000 requests
Completed 10000 requests
Finished 10000 requests


Server Software:        nginx/1.14.0
Server Hostname:        api.sensibull.test
Server Port:            443
SSL/TLS Protocol:       TLSv1.2,ECDHE-RSA-AES256-GCM-SHA384,2048,256
TLS Server Name:        api.sensibull.test

Document Path:          /v1/instrument_details
Document Length:        63 bytes

Concurrency Level:      20
Time taken for tests:   16.502 seconds
Complete requests:      10000
Failed requests:        0
Non-2xx responses:      10000
Total transferred:      2690000 bytes
HTML transferred:       630000 bytes
Requests per second:    606.00 [#/sec] (mean)
Time per request:       33.003 [ms] (mean)
Time per request:       1.650 [ms] (mean, across all concurrent reque
Transfer rate:          159.19 [Kbytes/sec] received

Connection Times (ms)
              min  mean[+/-sd] median   max
Connect:        1    2   0.9      2      20
Processing:     1   31   6.3     30      72
Waiting:        1   31   6.3     29      72
Total:          3   33   6.5     31      75

Percentage of the requests served within a certain time (ms)
  50%     31
  66%     33
  75%     35
  80%     36
  90%     40
  95%     47
  98%     53
  99%     58
 100%     75 (longest request)
Make sure that Non-2xx response count is 0. Otherwise, you’d end up benchmarking the performance of your API server to dole out errors. Silly as this may sound, I committed this blunder a couple of times.
Visualizing the Profiler Results
The generated profile file is a binary format that needs a visualizer to read. Snakeviz does a great job with this:
snakeviz instrument_details_profile.prf
You should get a result which looks something like this:
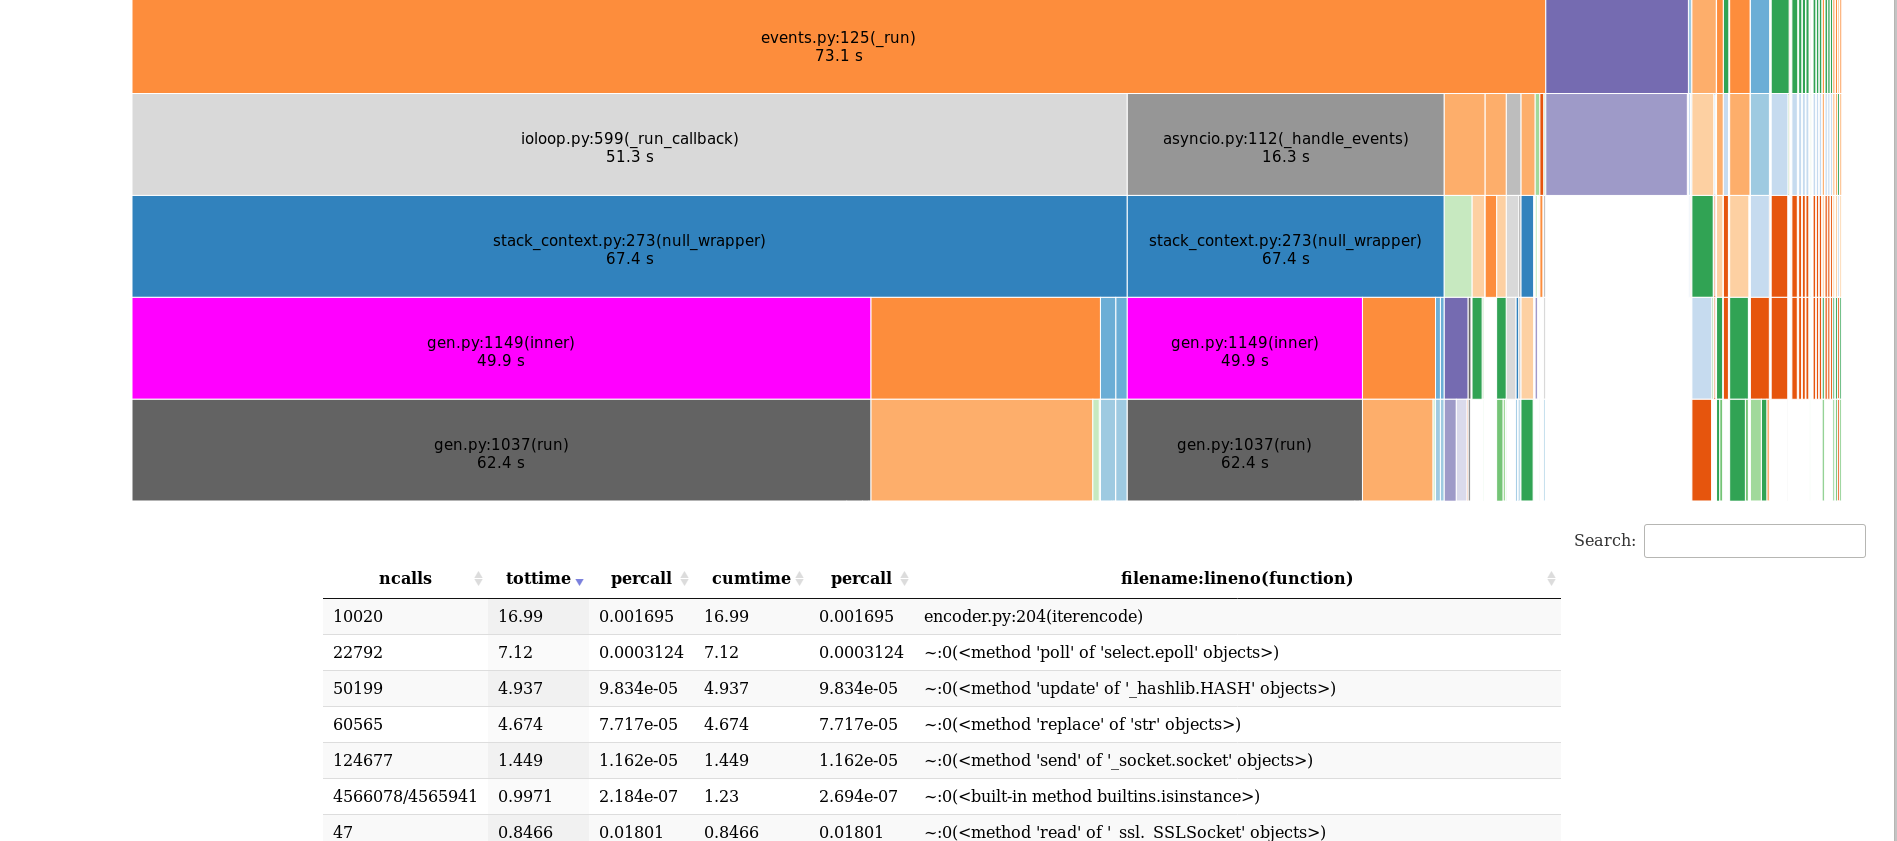
Interpreting the Profiler Results
The key result from the above visualization table, is the first entry when you sort by the tottime column. This column shows the total time spent in the given function (and excluding time made in calls to sub-functions). Note that most of the time being spent in one function may not necessarily indicate a bottleneck. This time may simply be time that your service handler spent fetching a record from a table. While you may want to investigate why DB fetch times or time needed to retrieve cache data is high, time spent waiting for IO does not increase CPU loads.
The key is to identify which function specifically ends up consuming most of the execution time AND determine if that function is CPU intensive.
For eg. in the previous image snapshot from snakeviz, you see that most of the time was spent in encoder.py from the Python standard library’s json package. This is a huge hint as to the fact that this service is going to hurt your asyncio event loop’s performance. The above result shows that most of the execution time was spent doing JSON serialization.
Removing CPU Bottlenecks from async services
Removing the CPU bottlenecks from your API pipeline requires some creativity. Some possibilities to consider are:
- Can you change the shape of the data that you are storing in cache or DB so that you can send the data as is, as a string, without first parsing it and then paying again for serializing it? For eg. the solution we used at work was just to read from the cache and send the string that was read AS IS, without paying for the price of parsing it and then serializing it again to send it back to client.
- Can you offload the performance intensive part to another process altogether via RPC?
- Can you run the CPU bound function in a thread-pool or process-pool that asyncio provides?
Once you remove the bottlenecks, you should see the profiler showing the following result:

Things are looking much better now. Note that most of the time is spent in select.epoll which is basically asyncio waiting on events from some IO device, be it DB socket or Redis socket. This is what asyncio excels at and this does not block the CPU like JSON encode/decode does.
Happy debugging!
Leave a Comment